Six contestants, same prompt, same machine. Four open-weight 30B-class models running on my RTX 5090 through Pi and a local llama.cpp stack, plus OpenAI Codex (gpt-5.3-codex) and Claude Sonnet 4.6 as frontier controls. All given the same broken Python project to fix. All measured against the same 35-test pytest suite. Zero API spend: Codex through ChatGPT Plus OAuth, Claude through claude -p against a Pro subscription.
When the dust settled, the fastest fix came from a local model on my desk: Qwen3-Coder-30B-A3B in 32 seconds. Claude Sonnet 4.6, the most heavily engineered, most-marketed coding agent in 2026, finished sixth at 113 seconds. Identical correctness across the board. The only thing that varied was wall clock, and the answer wasn’t what I expected.
But that’s Round 5. I ran five rounds in a single afternoon. Some of them made the local models look much worse than that. The interesting part is the shape of which tasks each model wins and which it doesn’t, because once you see the pattern, “should I use a local model or a frontier one?” becomes a much sharper question than the binary it usually gets framed as.
Here’s the data, the surprises, and what to do with it if you’re picking a stack in 2026.
🧪 The Setup
One workstation. Four GGUFs. Two frontier subscriptions. $0 marginal cost.
One RTX 5090, 32 GB VRAM. Four open-weight 30B-class GGUFs already on disk, all served through a single llama-swap instance on localhost:8090. Pi 0.75.5 as the agent harness, configured to talk to llama-swap as an OpenAI-compatible provider.
Quick aside on a piece of jargon I’m about to lean on a lot: tool calling is the mechanism that lets an agent actually do things: read a file, run a shell command, edit code on disk. Without it, the agent can only talk. Getting tool calling to work reliably across four different local models took most of an afternoon of per-model tuning, because each model was trained to emit tool calls in a slightly different format and the parser on the inference side has to agree. The community-favored “fixed Qwen template” (a popular drop-in replacement that fixes ~20 other issues) actually breaks llama.cpp’s tool-call parser. Each model needed its own incantation. That whole layer is a separate Deep Dive.
The four locals:
| Model | Quant | Total | Active | Class |
|---|---|---|---|---|
| Qwen3-Coder-30B-A3B | Q5_K_M | 30 B | 3 B | MoE, no-think, coding-tuned |
| Qwen3.6-27B | Q5_K_M | 27 B | 27 B | dense, thinking, general flagship |
| Qwen3.5-35B-A3B | Q4_K_M | 35 B | 3 B | MoE, thinking |
| Gemma 4 31B IT | Q5_K_M | 31 B | 31 B | dense, no-think (Google) |
A quick glossary if some of those terms are new:
- MoE (Mixture of Experts) is a model architecture where only a fraction of the parameters fire on any given token. Qwen3-Coder is “30B total / 3B active”: the full 30B has to fit in VRAM, but each token only routes through ~3B of those parameters. MoE models punch above their weight on speed because they decode like a smaller model while still having a bigger one’s knowledge to draw on.
- Thinking vs no-think: thinking models emit a hidden internal reasoning trace (think of it as the model talking to itself) before their actual reply. Slower, but usually more careful on hard problems. Not a prompt trick: the model was trained from day one to do this.
- Coding-tuned means the training data was heavily weighted toward code and programming tasks rather than general internet text. In theory: better at code. In practice, as we’ll see, “better at producing code” turns out to be different from “better at producing code that works.”
- Quant (e.g. Q5_K_M, Q4_K_M) is how compressed the model weights are. Smaller numbers = more aggressive compression = less VRAM but slightly worse quality. Q5_K_M is “nearly lossless” territory; Q4_K_M trades a bit more quality for memory.
And for the agentic test at the end, two frontier controls, both running on subscriptions I already had, both at $0 marginal cost:
- OpenAI Codex (gpt-5.3-codex) via Pi + OAuth, against my ChatGPT Plus subscription
- Claude Sonnet 4.6 via
claude -pheadless, against my Claude Pro subscription. Different harness on purpose: Pi for the locals + Codex, Claude Code for Claude. That’s how a builder actually uses each of these in 2026. A 5090 owner runs Pi or Aider against local GGUFs. A Claude user runs Claude Code. Forcing all six through one harness would have been a more “apples-to-apples” comparison and a less useful one.
The bench format across all rounds: identical brief per round, identical prompt, fresh per-model working directory, no iteration, no corrections. Drop the BRIEF.md, say “implement it,” walk away. Then evaluate.
Five rounds. Each round tested a different shape of task. The results stratify these models cleanly along a dimension nobody talks about enough.
🎨 Round 1: The Particle Sim That Didn’t Move
Same brief, four implementations, one fails the spec at default load
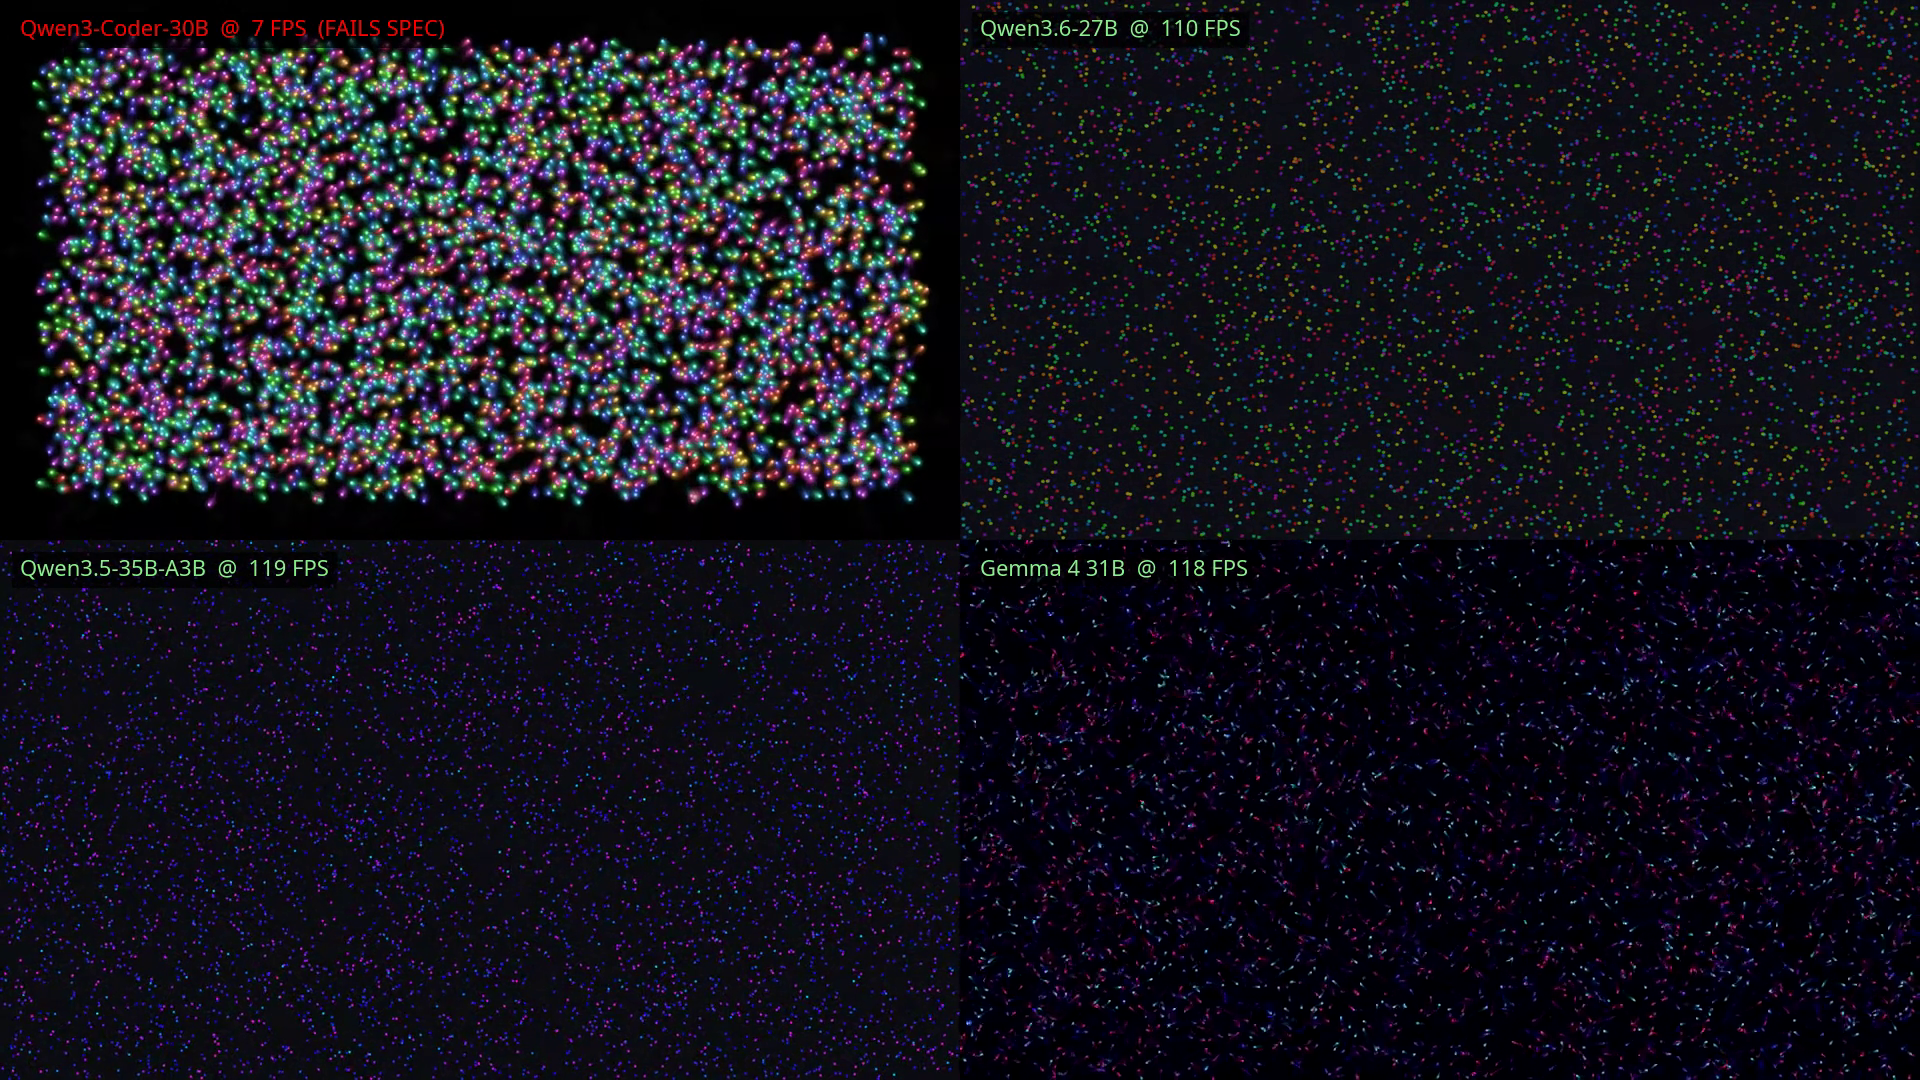
The first brief was deliberately visual and quantitative. Each model had to produce a single simulation.html file: 1,000+ particles bouncing on a canvas, mouse attract/repel, four sliders for gravity/friction/count/size, a reset button, an FPS counter on-screen. 60 FPS target. Same brief, same constraints, four implementations.
Then I had Claude measure each one in Chrome driven by chrome-devtools-mcp: load the file, wait 3 seconds for FPS to stabilize at 1,000 particles, read the on-screen counter, push the slider to 5,000 particles, wait 4 more seconds, read again.
The numbers:
| Model | FPS @ 1k | FPS @ 5k | Δ |
|---|---|---|---|
| Qwen3-Coder-30B-A3B | 40 | 7 | −82.5% |
| Qwen3.6-27B | 118 | 110 | −6.8% |
| Qwen3.5-35B-A3B | 121 | 119 | −1.7% |
| Gemma 4 31B | 120 | 118 | −1.7% |
Why? Reading Coder’s code reveals a layered failure that’s easy to miss on first pass: three textbook Canvas 2D performance pitfalls plus a fourth issue of a different shape: an architectural redundancy where the same visual effect is implemented twice. The three code-level pitfalls first, since they’re the kind of mistake every JavaScript engineer learns to avoid. All four happen in the inner rendering loop, the code that runs for every particle, 60 times a second.
1. The glow effect (ctx.shadowBlur = 10) tells the canvas to draw each particle with a soft halo around it. Looks pretty. Under the hood, the browser implements that glow by running a Gaussian blur filter over the rendered pixels, the same kind of operation as Photoshop’s blur tool. Every time you draw a shape with shadowBlur turned on, the renderer does an extra blur pass. With 1,000 particles at 60 FPS, that’s 60,000 blur operations per second just for the glow. Coder’s Round 2 attempt to “fix” this by changing the blur radius from 10 to 5 didn’t help, because the cost is in the blur happening at all, not in how wide it is.
2. The 3D shading (ctx.createRadialGradient(...)) creates a smooth color transition from each particle’s center outward, giving it a fake “3D ball” appearance. The catch: the code creates a brand-new gradient object in JavaScript memory for every particle on every frame, uses it once, then discards it. Those discarded objects pile up until JavaScript’s automatic memory cleanup (the garbage collector) decides to deal with them, and when it does, it pauses the main thread to do the work. That pause shows up as a frame stutter. The fix would have been to create the gradient once, when the particle is born, and reuse it forever. The model didn’t think to do that.
3. The trail rendering parses a string for every trail point on every particle on every frame. Each particle’s color is stored as text like "hsl(180, 80%, 60%)". The trail-drawing code wants to extract just the hue number (180) to fade the trail, and it does that by parsing the string: this.color.split('(')[1].split(',')[0]. Each .split() call creates new little string objects in memory. This whole line runs inside the trail-drawing loop, which runs for every trail point on every particle on every frame:
1,000 particles × 10 trail points × 60 frames/sec × 3 strings per call ≈ 1.8 million throwaway strings per second
All of which immediately get fed back to the same garbage collector that’s already drowning under (2). The fix is to store the hue as a plain number on the particle object when it’s created and never re-parse it.
4. The trail effect is implemented twice, in two different layers, on top of each other. This one’s a different shape from the first three. The global animate loop already draws a low-alpha black rectangle over the entire canvas each frame (ctx.fillStyle = 'rgba(0, 0, 0, 0.1)'; ctx.fillRect(...)), which produces a trail effect for free: old particle positions don’t get cleared, they fade out gradually as that semi-transparent overlay accumulates. But Coder also maintains a per-particle history (each particle stores its last 10 positions) and redraws all 10 of them as separate arc + fill calls every single frame. At 1,000 particles × 10 trail points × 60 FPS, that’s 600,000 redundant arc operations per second, doing the exact same job the global overlay is already doing. The first three issues are about how the code does the work; this one is about whether the work needs to be done at all. It went unnoticed.
Two anti-patterns stacked on top of each other. The three code-level pitfalls share one shape: doing work in the inner loop that should have been done once, when the particle was born. A good engineer’s instinct on a render loop is “compute once, reuse forever; never allocate in the hot path.” Coder’s code allocates and parses and re-blurs per particle per frame. The fourth issue is a different shape entirely: failing to recognize that two parts of the code are doing the same job. The expensive one duplicates the work of the cheap one. Anyone who profiled the inner loop would catch the first three; only someone reading the whole render pipeline holistically would catch the fourth (Thanks, Claude - because I wasn’t catching that one 😅).
Meanwhile Qwen3.6-27B (the “general” model) used real engineering hygiene throughout: allocation-free hot loop, retina-aware canvas, color-coded FPS counter, touch event handlers (not asked for, just added because they’re idiomatic), preventDefault on contextmenu so right-click “repel” doesn’t pop the browser menu. Sidebar with custom-styled slider thumbs. Looks like a finished product.
The model that looks most impressive in a still screenshot is the one that performs worst when you actually run it. Worth holding both thoughts at once.
If I’d stopped after Round 1, the story would have been clean: the coding model ships the most visually maximal sim and the worst-performing one. But what happens when you give it explicit failure feedback?
🔁 Round 2: When Feedback Isn’t Enough
Coder treats a perf bug as a tweak. Qwen3.6 trades half its headroom for substance.
The Round 2 brief told each model exactly what its Round 1 FPS numbers were and asked it to fix the problem.
For Coder, the brief was direct: “You hit 40 FPS at 1,000 particles. The brief required 60. Diagnose what’s costing FPS, fix it in place.”
Coder responded with three numeric tweaks, +0 LOC, and FPS still under spec:
- Trail length 10 → 5
shadowBlur10 → 5 (not removed, just smaller)- Mouse interaction radius 150 → 100
Result: 46 FPS at 1,000 particles, still failing the spec. It reduced shadowBlur rather than removing it. It shortened trails rather than removing them. It shrunk the mouse radius rather than optimizing the force math. The actual root causes (that shadowBlur triggers a Gaussian blur pass regardless of kernel size, and that the per-particle trail history was redundant with a global alpha-fade overlay already running in the animate loop) both went undiagnosed. The FIX_NOTES blamed “trail rendering and glow effects” generically without identifying which specific operation was the cost.
Given explicit failure feedback, the coding-specialized model produced patches in the same shape as the original code: surface-level edits that don’t touch the underlying mechanism.
Qwen3.6-27B, which had passed the spec at 118 FPS, got a different brief: pick one meaningful improvement. Qwen3.6 read its own Round 1 DEV_NOTES (which had said “with more time I’d add inter-particle collisions”), implemented a spatial hash grid for collision detection, and shipped it.
The cost of adding collision detection at all: FPS dropped from 118/110 to 57/57. Half the headroom, gone, in exchange for actually-physical particle interactions. A real engineering trade-off the model made deliberately, called out in its FIX_NOTES.
The other two locals did exactly what was asked. Qwen3.5-A3B fixed both noted issues (off-spec default count, an inaccurate self-eval claim) and implemented real throttling code to back up the claim. Gemma fixed the friction default (it had been 1.0, so particles never settled) and added velocity-driven opacity.
The pattern: each model has a stable response style. Coder tweaks symptoms. Qwen3.6 over-builds. Qwen3.5 follows instructions literally. Gemma makes small taste calls. You could predict each model’s Round N+1 behavior from its Round 1 output. That regularity matters for picking which one to put in front of a real workload.
🧠 Round 3: When the Spec Is the Test Suite
Two thinking models hit 100%. The “coding” model managed 15%.
Two rounds in, the data was telling a story: the coding model is bad at engineering.
Round 3 dissolved that.
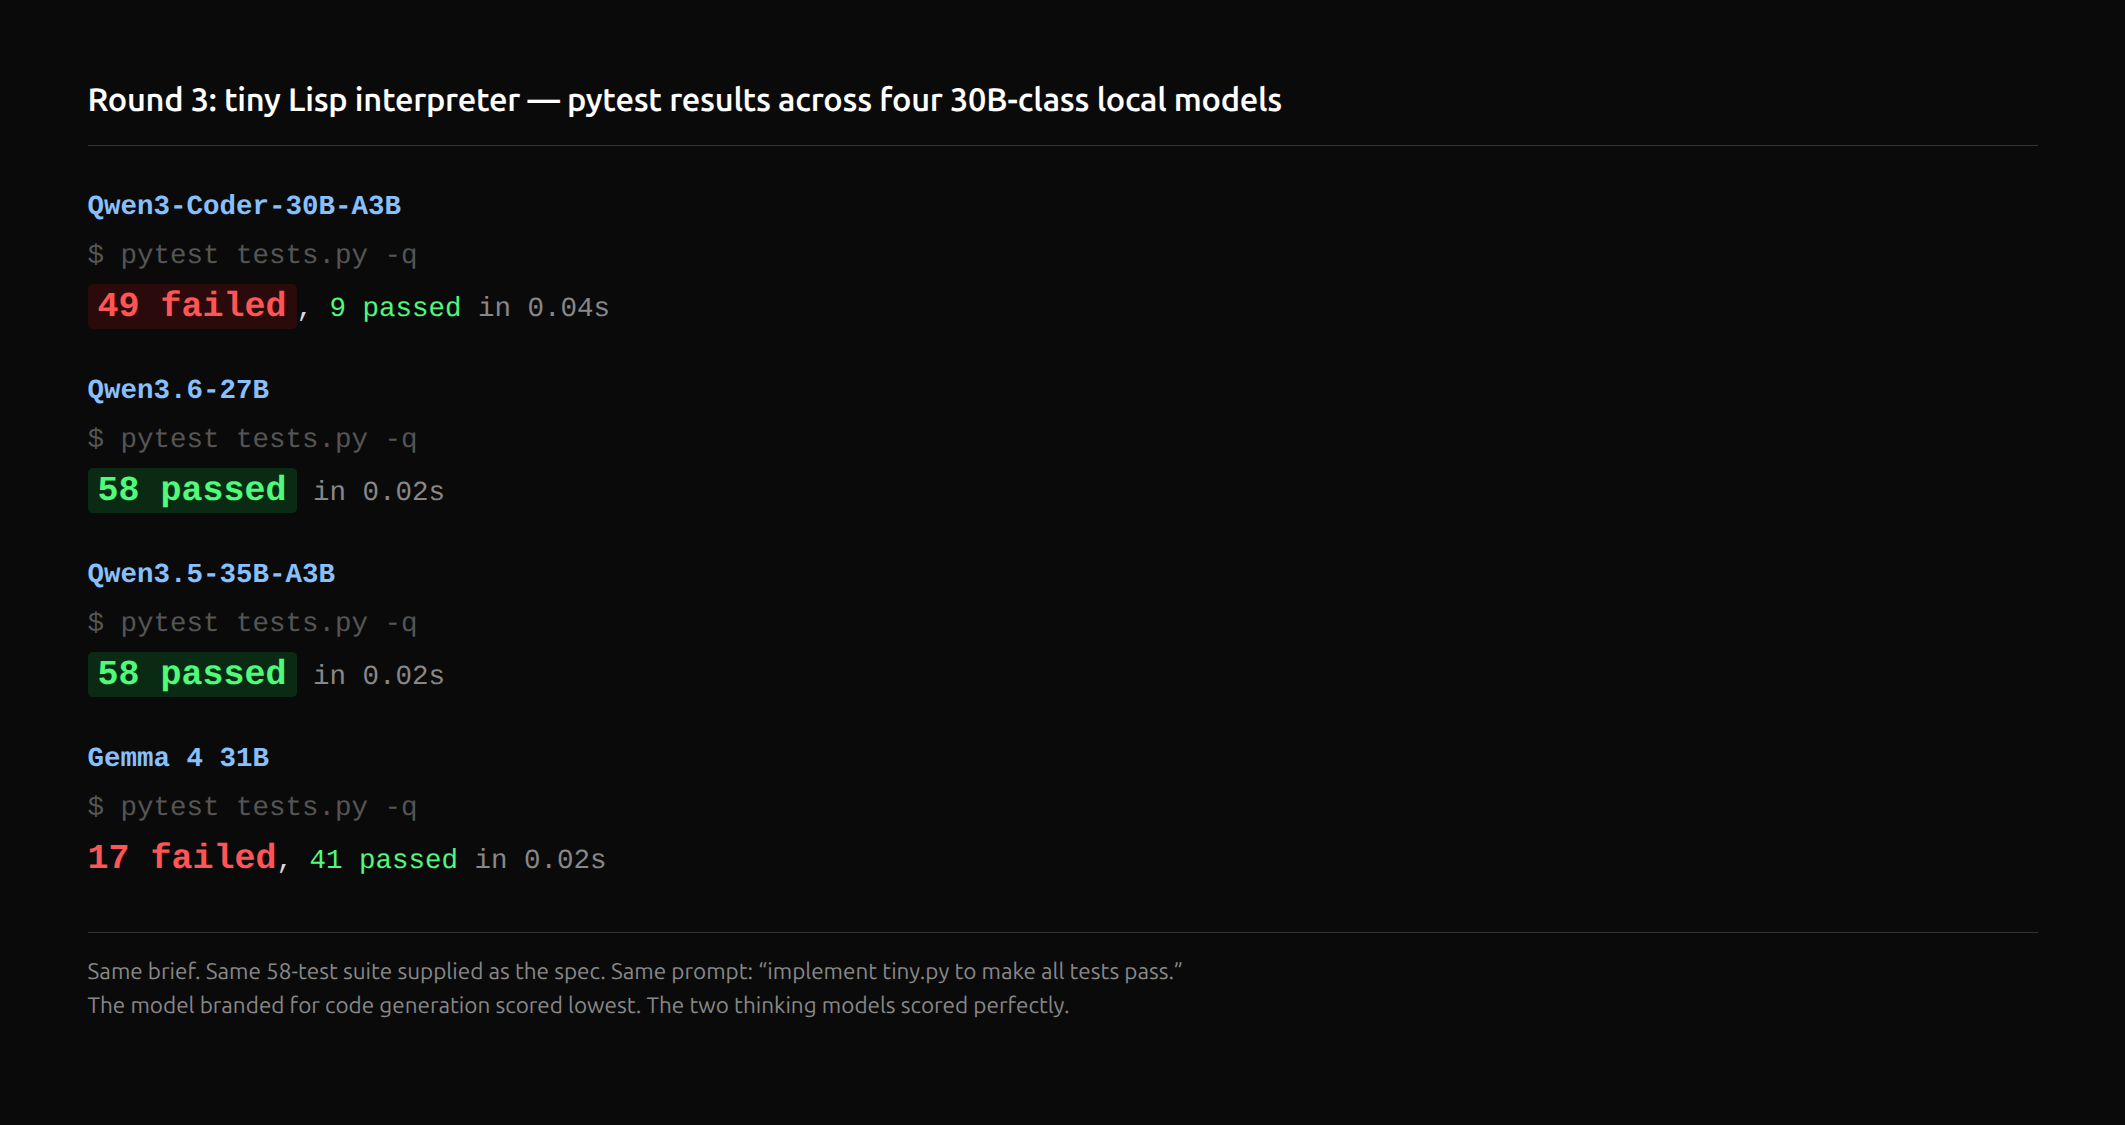
The brief: implement a small Lisp interpreter in a single Python file. S-expressions, integers, booleans, strings, lists, if, def, let, lambda with closures, recursion, car/cdr/cons. A 58-test pytest suite (written by Claude) supplied as the acceptance criterion. Make every test pass.
If you don’t write Lisp interpreters for fun: Lisp is a programming language family where everything is a list and the first thing in the list is the function. (+ 1 2) means “call the + function with arguments 1 and 2.” It looks unusual (lots of parentheses), but structurally it’s one of the simplest things to write an interpreter for, which is why it’s a classic first project for compiler-curious programmers. The interpreter does three things: tokenize (chop source code into pieces: (, +, 1, 2, )), parse (build those pieces into a nested tree structure), and evaluate (walk the tree and actually produce a result). Each of the three has lots of subtle places to get wrong (closures and lexical scoping in particular are famous traps), and the test suite hits the most common ones.
No visual surface to hide behind. No subjective “is this pretty.” Just: did your interpreter actually run programs correctly?
| Model | Tests passed | Time | LOC |
|---|---|---|---|
| Qwen3.6-27B | 58 / 58 (100%) | 361s | 421 |
| Qwen3.5-35B-A3B | 58 / 58 (100%) | 119s | 551 |
| Gemma 4 31B | 41 / 58 (71%) | 222s | 259 |
| Qwen3-Coder-30B-A3B | 9 / 58 (15%) | 145s | 383 |
The two thinking models hit a perfect score. Qwen3.5-A3B’s 119-second perfect run is the bench’s standout single result: fastest model on the hardest job, no failed tests.
Qwen3-Coder produced 383 lines of code in 145 seconds. The parser was fundamentally broken. (+ 1 2) raised Cannot call 1: it put the integer in the function position. true and false evaluated to the literal strings 'true' and 'false'. "hello" came out as '"hello"' (quotes never stripped). The 9 tests that passed were either trivial (42 returning 42) or error tests where any exception counted.
Coder’s DEV_NOTES claimed “multiple iterations to fix parsing issues” and “4-5 hours spent.” Actual elapsed: 145 seconds 🤣 The model never ran its own code 💀🪦
This was the data point that should have killed the “coding model” framing entirely. Handed a complete spec (the test suite itself) on a task purpose-built for a code-generation model, Coder produced 15% working code in two and a half minutes and stopped.
Or so I thought...
🏗️ Round 4: The Boilerplate Twist
Same brief, four passing implementations, 3.1× LOC range, four different aesthetics
Round 4 was supposed to be the hardest test of the bench: a multi-file Go project that bundles a database, full-text search engine, and web UI into a single self-contained binary. Specifically:
modernc.org/sqlitefor storage: a pure-Go port of the SQLite database engine, meaning no C compiler dependency at build time. Trade-off: slightly slower than the standard C-based driver, but it just compiles. Models that don’t pick the pure-Go option end up fighting CGO setup, which usually goes badly.- FTS5 full-text search: SQLite’s built-in search engine extension. It’s what powers “search across all your notes” in apps like Bear or Obsidian. You define a virtual table with
MATCHqueries, set up triggers to keep it in sync with your real table, and you get fast text search for free. - Embedded HTML UI via
go:embed: Go’s built-in mechanism for baking files (HTML, CSS, JS, images) directly into the compiled binary so you ship one file instead of a directory. - JSON API, visual quality criteria, the works.
All-or-nothing integration tests: does go build succeed, does the binary serve HTTP, does POST create a note, does FTS5 find a unique-needle word, does DELETE work cleanly. Eleven binary pass/fail checks per contestant.
If the Round 3 pattern held (locals struggle on semantic-heavy work), I expected Coder to flounder.
The result:
| Model | Build | Integration | Time | LOC | UI embedding |
|---|---|---|---|---|---|
| Qwen3-Coder-30B | ✅ | 11 / 11 | 81s | 568 | string literal |
| Qwen3.6-27B | ✅ | 11 / 11 | 149s | 718 | text/template |
| Qwen3.5-35B-A3B | ✅ | 11 / 11 | 53s | 312 | go:embed |
| Gemma 4 31B | ✅ | 11 / 11 | 220s | 229 | go:embed |
Four for four. Every model produced a buildable Go binary that passed every integration test. SQLite triggers correct. FTS5 search working. HTTP endpoints returning the right shapes. go.mod and go.sum properly generated. Eight minutes total across all four runs.
And the LOC spread between Gemma’s 229 lines and Qwen3.6’s 718 is 3.1×, for the same passing functionality.
lines of code for the same passing functionality
Qwen3.6 (the “engineer” from earlier rounds) over-engineered. text/template for HTML embedding (overkill, a plain string was fine), a sync.Mutex guarding all DB operations (correct but database/sql already serializes), CSS custom properties, a modal note view, search-result cards. Every choice individually defensible. The total was almost three times the size of Gemma’s working minimal version.
Gemma’s 229-LOC implementation was the cleanest of the four. go:embed for the UI, plain stdlib routing, minimal triggers, accurate handling of the FTS5 “delete” pseudo-command syntax (called out specifically in its DEV_NOTES, a real domain detail no other model mentioned).
The LOC range hides a richer visual diversity story. All four binaries pass the same integration tests and seed with the same notes, but the four UIs are recognizably different from across the room:
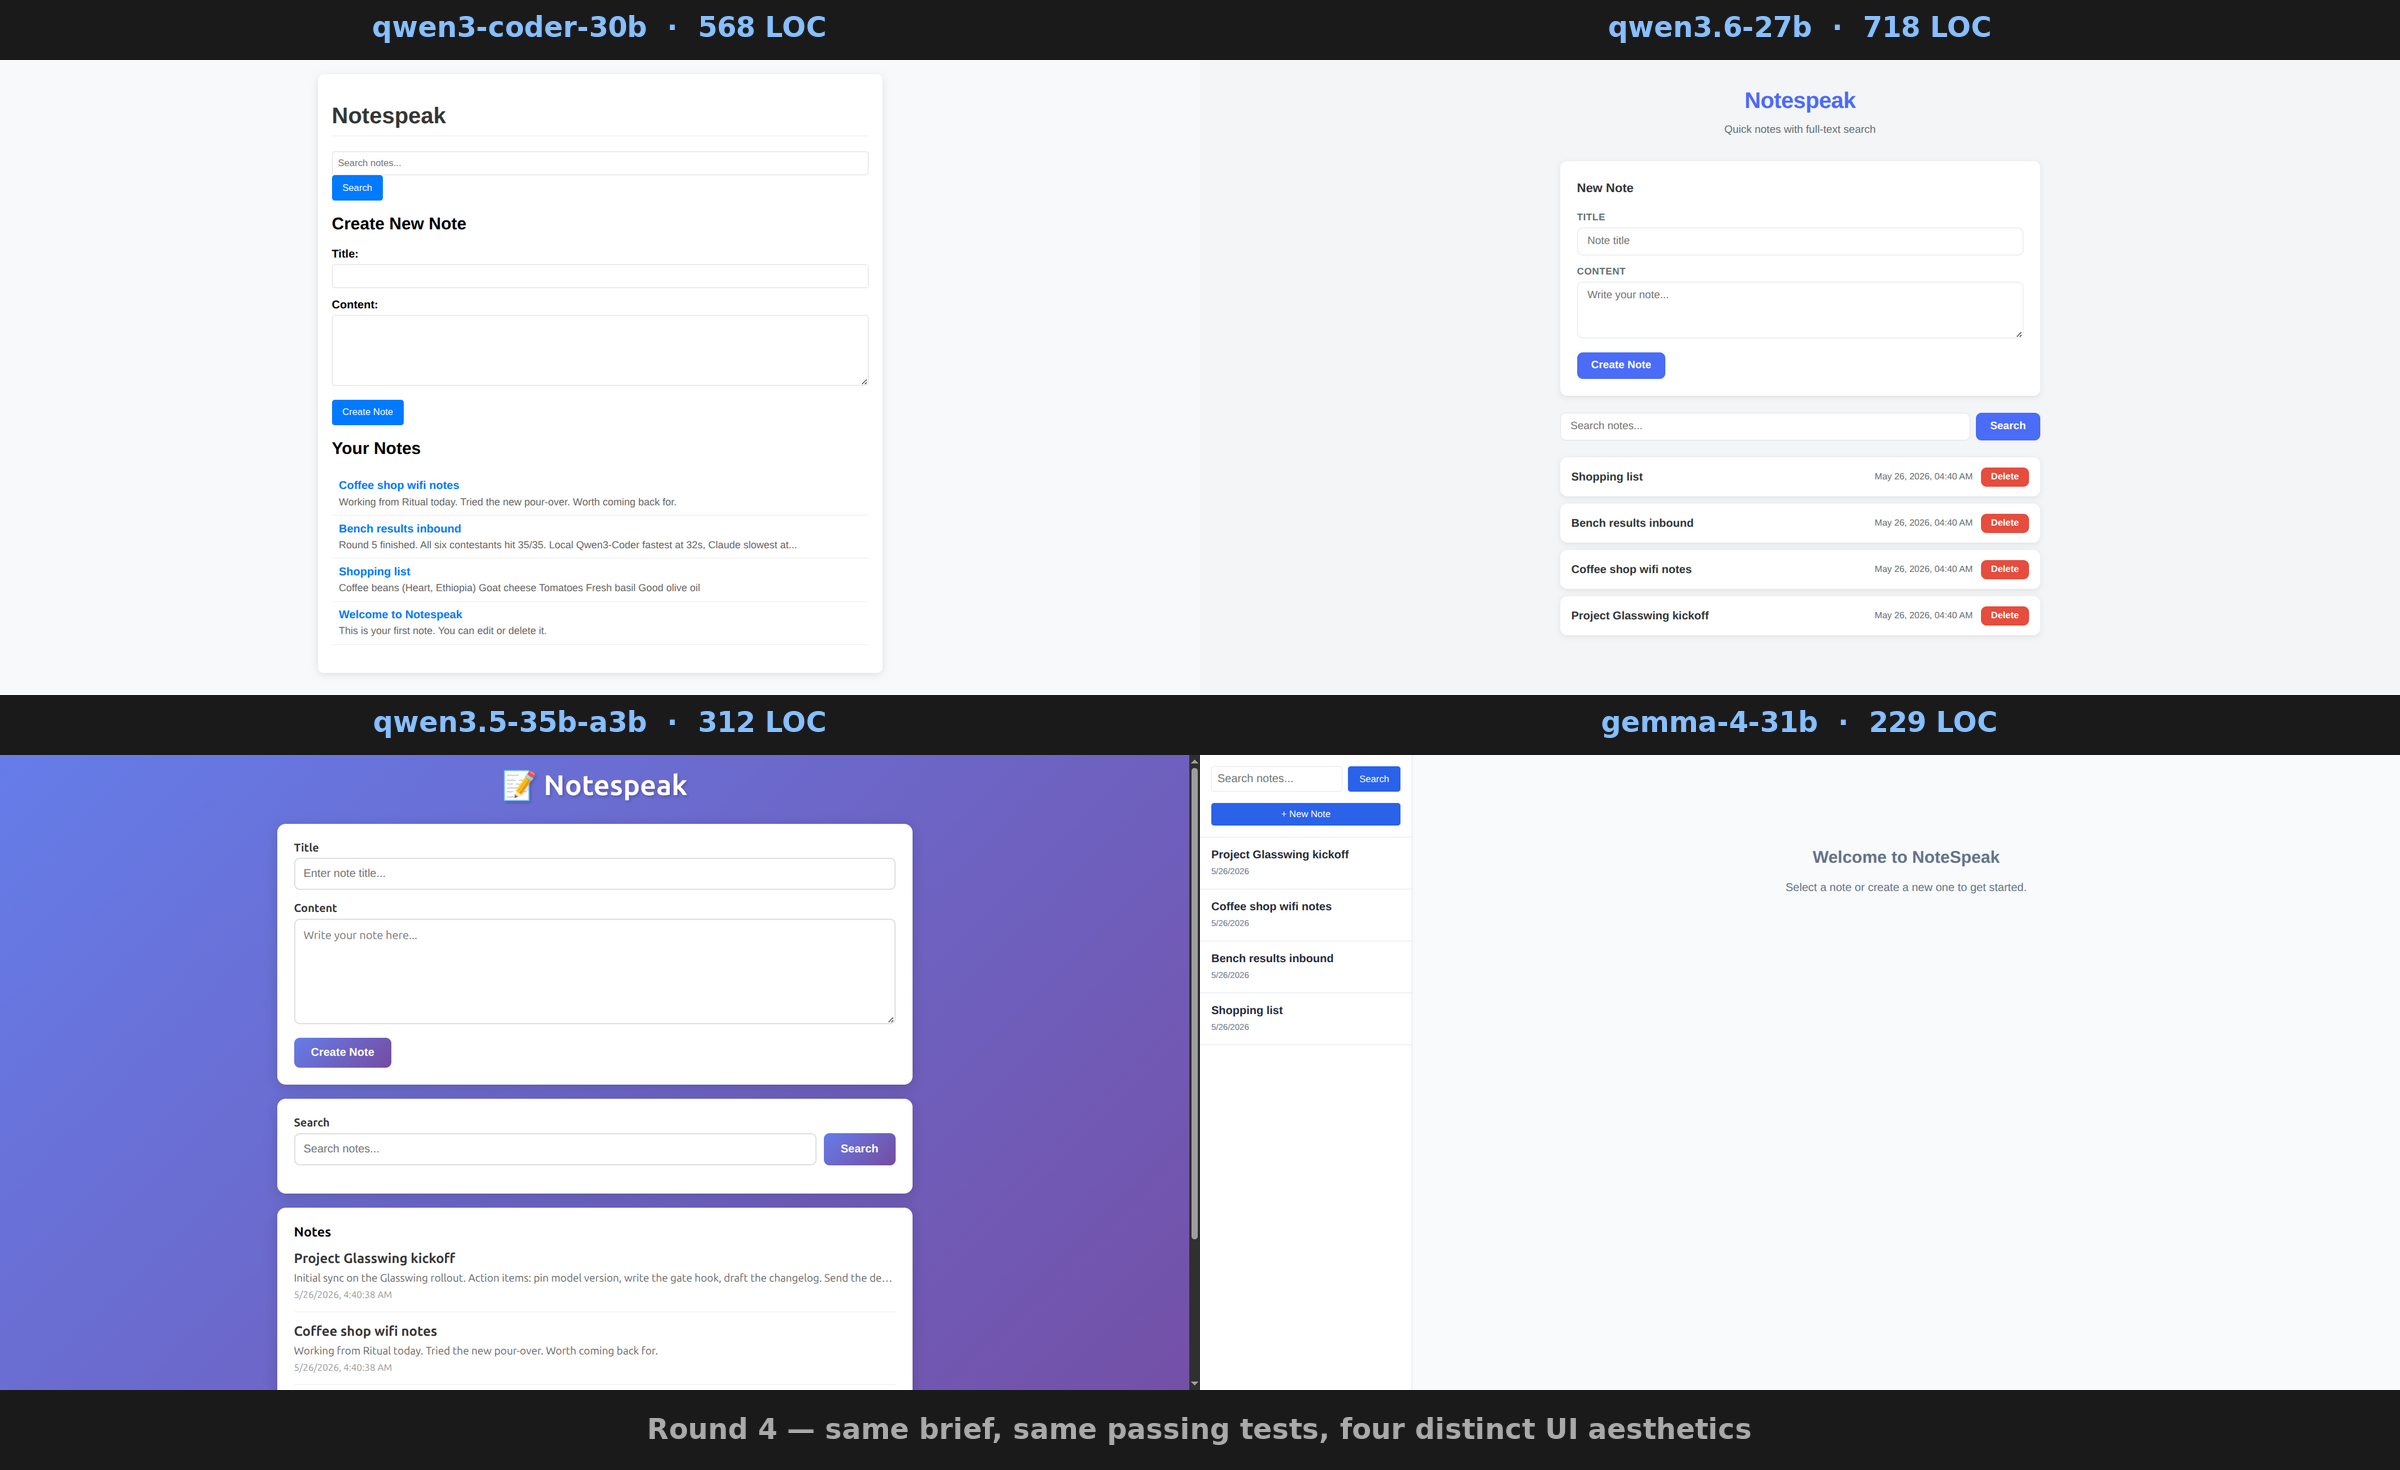
- Coder (568 LOC): minimal raw-Bootstrap-looking single-column form. Functional, unstyled.
- Qwen3.6-27B (718 LOC): clean modern card-based layout, bright red delete buttons, “Quick notes with full-text search” subtitle. Reads like a finished product.
- Qwen3.5-35B-A3B (312 LOC): purple gradient background, emoji icon in the header, rounded corners, indigo accent buttons. Designer aesthetic, looks like something out of a SaaS landing page.
- Gemma 4 31B (229 LOC): split-pane sidebar app layout, notes list on the left, content area on the right, “Welcome to NoteSpeak” empty state. Closer to Bear or Apple Notes than to a form-and-list page.
Two outliers in different ways. Qwen3.5 broke ranks on visual styling; Gemma broke ranks on layout architecture. The “coding” and “general” models defaulted to similar utilitarian column layouts. The thinking MoE and the dense Gemma each picked a deliberately distinctive aesthetic without being asked. Same brief, same passing tests, four genuinely different products.
So Round 4 broke the Round 3 narrative. When the task is on-distribution (standard Go HTTP API + SQLite + embedded UI, the kind of thing every model has seen 10,000 variants of in training), all four 30B-class locals produced working code in under four minutes. When the task was off-distribution (write a bespoke Lisp interpreter where the semantics matter), only the thinking models passed.
The “Coder is bad at code” story was wrong. The truer claim was emerging: specialization matters for what kind of code.
🐛 Round 5: The Real Agentic Test
Local Qwen3-Coder: 32 seconds. Claude Sonnet 4.6: 113. Both produced 35/35 passing tests.
The first four rounds had a structural limitation. Every test was single-shot. The model got a brief, produced an artifact, scored. No iteration, no tool use across turns, no recovery from mistakes. That isn’t how agents work in practice.
Round 5 fixed that. The test: agentic debugging on a real codebase.
My Claude co-researcher wrote a working 350-LOC Python project, a todo CLI with persistent JSON storage. Four files, a clean 35-test pytest suite, everything green. Then we intentionally introduced 10 bugs across 4 files of varying difficulty: wrong default values, dropped logic, inverted conditionals, missing storage calls. The buggy baseline failed 13 of 35 tests.
Each contestant got the buggy codebase, the test suite, and this prompt:
Read BRIEF.md carefully, then read models.py, storage.py, todo.py, and tests.py. Run
pytest tests.py -qto see which tests are failing. Fix the bugs in the application code (NOT in tests.py) so that all 35 tests pass. Use bash to run pytest as you iterate. When all tests pass, write FIX_NOTES.md describing each bug you fixed, then reply with the single word “done”.
To detect cheating (“fix” the failing tests by deleting them), Claude captured a sha256 of tests.py before and after each run.
And this round, we added the frontier controls. Six contestants, three different harnesses, $0 marginal cost: four locals via Pi, Codex via Pi + OAuth, Claude via claude -p.
The scoreboard:
| Rank | Contestant | Tests | Tampered? | FIX_NOTES | Time |
|---|---|---|---|---|---|
| 1 | Qwen3-Coder-30B-A3B | 35 / 35 | no | yes | 32s |
| 2 | Qwen3.5-35B-A3B | 35 / 35 | no | yes | 36s |
| 3 | Codex (gpt-5.3-codex) | 35 / 35 | no | yes | 45s |
| 4 | Gemma 4 31B | 35 / 35 | no | yes | 65s |
| 5 | Qwen3.6-27B | 35 / 35 | no | yes | 66s |
| 6 | Claude Sonnet 4.6 | 35 / 35 | no | yes | 113s |
Every contestant scored perfectly. Every model identified every bug. Every model left the test suite untouched. The only thing that varied was wall clock, and the variance is the whole story.
The two fastest models in this bench are local 30B-class running on the workstation. Qwen3-Coder finished in 32 seconds. Qwen3.5-A3B in 36. Codex via OpenAI’s API came in third at 45s. Claude Sonnet 4.6 (frontier model, canonical harness, “best in class” coding agent) was the slowest at 113 seconds, 3.5× slower than the fastest local.
time to complete from the frontier coding agent, for identical 35/35 results
The same Qwen3-Coder that failed Round 1’s spec, failed Round 2’s fix-it task, and scored 15% on Round 3’s Lisp interpreter, was the fastest agent in the bench on a task that more closely resembles real software work than any of the prior rounds. Faster than Codex. Faster than Claude.
The “Coder is bad” frame from R1–R3 dissolved. The true frame: Coder is great when the spec is explicit and the work is incremental. R3 (write a Lisp from scratch, semantics matter) → bad. R4 (boilerplate Go scaffolding) → fast. R5 (debug to make failing tests pass, with the tests as the spec) → fastest in the bench by a wide margin. The branding wasn’t lying. It was just narrower than implied.
What the FIX_NOTES revealed
All six contestants identified all 8 distinct bug-fix categories (some bugs touched the same function). The differences showed up in the writeup quality, and they stratified cleanly:
- Claude Sonnet 4.6 wrote the most rigorous documentation. Every fix cited the specific test name that drove the requirement: “caught by
test_create_basicandtest_default_priority”. Reads like a senior engineer’s PR description. - Qwen3.6-27B grouped bugs by root cause: “the
done_atNone failures in both model and storage tests traced back to a single bug inmark_done().” Shows architectural thinking. - Codex wrote terse, accurate, professional-doc-style notes. No fluff.
- Qwen3.5-A3B and Gemma wrote complete numbered lists, layer-by-layer. Functional but generic.
- Qwen3-Coder identified every bug but the language was the most generic in the bench: “This was fixed by changing the default value in the dataclass definition”, repeated for each bug. Fastest fixer, most boilerplate notes.
Universal confabulation, with one outlier
Every model claims to know how long it spent. Every model is wrong by an enormous factor, and the size of the wrongness ranks them:
| Contestant | Time claim | Actual | Overestimate |
|---|---|---|---|
| Claude Sonnet 4.6 | “~5 min” | 113s | 2.6× |
| Qwen3.6-27B | “~5 min” | 66s | 4.5× |
| Codex | “10–15 min” | 45s | 20× |
| Qwen3.5-A3B | “~15 min” | 36s | 25× |
| Gemma 4 31B | “~30 min” | 65s | 28× |
| Qwen3-Coder-30B | “~30 min” | 32s | 56× |
Claude is genuinely better at knowing how long it took. That’s real metacognition. Qwen3-Coder’s 56× (“30 minutes” on a 32-second task) is the worst time perception of any model in any round of this bench. Self-evaluation accuracy reads as a proxy for actual self-modeling capability, and the rankings hold.
⏱️ A side note on AI bedside manner
Claude, please stop telling me to get some rest or that we've been at it a long time so are at a good stopping point. And, no, we've not been at it for hours - it's just been 30 minutes!
Same time-blindness that has Claude estimating "5 min" on a 113-second task also has it estimating "hours" on a 30-minute conversation. Even the model with the best metacognition in the bench still confidently misreads the clock.
What this round actually shows
Caveats matter, and they’re real:
- The bench is small (350 LOC, 10 bugs). Bigger codebases would stress local context limits; Claude’s 200k window becomes useful when surface area exceeds what fits comfortably.
- Claude Sonnet 4.6 likely ran more verification passes than the others. Claude Code re-runs tests, double-checks edits, verifies via inspection. The extra time is buying real diligence. For code touching production, migrations, or security-sensitive paths, that’s exactly what you want.
- The locals benefited from the test suite acting as a clear spec. In Round 3, when the spec was “write a Lisp interpreter from scratch,” Qwen3-Coder scored 15%. Same model, here, with explicit failing tests pointing at exact functions: 35/35 in 32s.
But “on a well-specified iterative task, your 5090 runs faster than Claude on the same brief” is a real, measurable claim. If you bought a Blackwell card last year, the bench is the receipt that the math works.
🎯 What I’d Actually Pick
| Round | Coder | Qwen3.6 | Qwen3.5 | Gemma | Codex | Claude |
|---|---|---|---|---|---|---|
| R1 particle sim @1k | 40 FPS | 118 FPS | 121 FPS | 120 FPS | n/a | n/a |
| R2 fix R1 | 46 FPS | 57 FPS+collisions | 110 FPS | 112 FPS | n/a | n/a |
| R3 Lisp interpreter | 9 / 58 | 58 / 58 | 58 / 58 | 41 / 58 | n/a | n/a |
| R4 notespeak Go | 11 / 11 | 11 / 11 | 11 / 11 | 11 / 11 | n/a | n/a |
| R5 agentic debug | 32s ⭐ | 66s | 36s | 65s | 45s | 113s |
Five rows, six columns, one clear pattern: no model is green across the board, and no model is red across the board. Each contestant has a shape. Here’s the model picker the bench earns:
| Job-to-be-done | Best contestant |
|---|---|
| Working CRUD / web boilerplate, lowest LOC | Gemma 4 31B, 229 LOC for a working full-stack Go binary |
| Working CRUD, fastest first-runnable artifact | Qwen3-Coder-30B, 20s for the particle sim, 32s for the agentic debug |
| Highest single-shot artifact quality, willing to wait | Qwen3.6-27B, only local with retina, touch, contextmenu prevention, and an allocation-free hot loop |
| Best speed/quality combo overall | Qwen3.5-35B-A3B, perfect Lisp interpreter at 119s, perfect debug at 36s |
| Most rigorous self-evaluation, slowest, most verification | Claude Sonnet 4.6, only model citing specific tests by name |
| Frontier on Pi stack (continuity with local workflow) | Codex (gpt-5.3-codex), clean middle of the pack |
🛠️ Three Things to Take Home
1. “Coding model” branding doesn’t predict outcomes. Task shape does.
Qwen3-Coder is sold as a coding-specialized MoE. The bench shows what that means in practice: great at incremental, well-specified work (R4 boilerplate, R5 debugging; fastest in the bench on both) and bad at greenfield semantic-precision work (R1 perf engineering, R3 writing a Lisp from scratch). The branding is closer to “fast pattern-matcher” than “best at code in general.”
Pick a coding-specialized model when you can hand it a clear spec and the work is patching/scaffolding/extending. Don’t pick one when the task requires the model to reason about semantics rather than recall a pattern. Those are different jobs.
2. Local 30B-class models on a 2025 consumer GPU are competitive with frontier on well-defined tasks.
The R5 result isn’t a fluke. Local Qwen3-Coder at 32s vs. Claude Sonnet at 113s on the same agentic debug is what happens when:
- The local model isn’t paying network latency (every API call to Claude or GPT goes over the internet; a local model’s call goes over your PCIe bus)
- The task fits comfortably in a 32K context window, the amount of text a model can hold “in mind” at once. 32K tokens is roughly 24,000 words. The bench codebase fits easily; a million-line monorepo would not.
- The spec is explicit (failing tests pointing at exact lines)
- The work is incremental, not deep reasoning
There’s a real region of “real software work” where the practical right answer is: run it locally, pay your electricity bill, skip the API. If you bought a 5090 in 2025/2026, this is the case that closes the loop.
The honest caveat: Claude’s extra 80 seconds on Round 5 was buying more thoroughness, not waste. Claude Code re-runs tests, double-checks edits, verifies via inspection. For production, migrations, or security-sensitive paths, the extra discipline is exactly what you want. The article isn’t “always go local.” It’s “you have a real choice, and the answer isn’t reflexively cloud.”
3. Self-evaluation accuracy correlates with output quality.
Across all five rounds, every model’s DEV_NOTES revealed something. Claude was the only contestant that ever cited specific test names for its fixes. Coder’s notes claimed “4–5 hours of iteration” on tasks that took 32–145 seconds. Qwen3.6’s notes accurately described its no-allocation hot loop discipline. Gemma’s notes called out the specific FTS5 delete-trigger syntax detail, the only model to do so.
If you’re going to evaluate models for real work, ask them to describe their own decisions and check whether the description matches the code. It’s a cheap eval. It surfaces something the pass/fail scoreboard can’t. And the rankings track everything else: the models that document themselves accurately also perform better on the harder, judgment-driven tasks.
🔁 Reproduce It
Every brief, every per-model implementation, every log, every screenshot, every runner script is in the tng-llm-bench companion repo. The whole bench runs in under an hour on the same hardware. If you have an RTX 5090 (or a 3090 with smaller quants), you can rerun the entire thing against any model that drops.
Stack:
- llama.cpp built with CUDA for sm_120 (Blackwell)
- llama-swap v217 on
:8090: proxies OpenAI-compatible requests, hot-swaps GGUFs, TTL-unloads idle models - Pi 0.75.5: agent harness, OpenAI-compatible provider, OAuth for ChatGPT/Claude/Copilot
- Claude Code 2.1+ for headless
claude -pruns against the Pro subscription - Q5_K_M and Q4_K_M quants from the unsloth GGUF series
The full per-model trees, runner scripts, BRIEF.md files, planted-bug references, and integration tests are in the tng-llm-bench companion repo. Same brief, same machine, different model: see what happens.
What’s Next
Five rounds covered single-shot artifact generation (R1, R3, R4), feedback-driven iteration (R2), and short-horizon agentic debugging (R5). What they didn’t test:
- Long-horizon planning across many tool calls. Real agentic work isn’t 35 tests in 30 seconds; it’s “build this feature, write the tests, refactor the surrounding code, update the docs,” over hours.
- Real-codebase work: operating against an existing repo with conventions, idioms, and prior decisions, not a synthetic 4-file toy.
- Verification of subtle changes: does the model notice when its fix breaks something subtle elsewhere?
That’s Round 6+ territory, and the harness is built to keep going. The framework I used here (clean per-contestant directories, identical briefs, automated forensic checks, integrated pytest/HTTP/Chrome eval) can swap in any new model that drops and produce comparable numbers in an afternoon.
Same brief. Same machine. Different model. See what happens.
Stay building. 🛠️